Note
Go to the end to download the full example code.
Plot on geometry elements#
This example shows how to plot a certain field in different geometric objects such as points, lines and planes.
Imports and load model#
Import modules and set context as Premium.
import matplotlib.pyplot as plt
import numpy as np

from ansys.dpf import core as dpf
from ansys.dpf.core import examples, operators as ops
from ansys.dpf.core.fields_factory import field_from_array
from ansys.dpf.core.geometry import Line, Plane, Points
from ansys.dpf.core.plotter import DpfPlotter
Load model from examples and print information:
model = dpf.Model(examples.find_static_rst())
print(model)
DPF Model
------------------------------
Static analysis
Unit system: MKS: m, kg, N, s, V, A, degC
Physics Type: Mechanical
Available results:
     -  node_orientations: Nodal Node Euler Angles
     -  displacement: Nodal Displacement
     -  reaction_force: Nodal Force
     -  stress: ElementalNodal Stress
     -  elemental_volume: Elemental Volume
     -  stiffness_matrix_energy: Elemental Energy-stiffness matrix
     -  artificial_hourglass_energy: Elemental Hourglass Energy
     -  kinetic_energy: Elemental Kinetic Energy
     -  co_energy: Elemental co-energy
     -  incremental_energy: Elemental incremental energy
     -  thermal_dissipation_energy: Elemental thermal dissipation energy
     -  elastic_strain: ElementalNodal Strain
     -  elastic_strain_eqv: ElementalNodal Strain eqv
     -  element_orientations: ElementalNodal Element Euler Angles
     -  structural_temperature: ElementalNodal Structural temperature
------------------------------
DPF  Meshed Region:
  81 nodes
  8 elements
  Unit: m
  With solid (3D) elements
------------------------------
DPF  Time/Freq Support:
  Number of sets: 1
Cumulative     Time (s)       LoadStep       Substep
1              1.000000       1              1
Load model’s mesh and define camera position
(obtained with cpos=pl.show_figure(return_cpos=True)). This will be used
later for plotting.
mesh = model.metadata.meshed_region
cpos = [
    (0.07635352356975698, 0.1200500294271993, 0.041072502929096165),
    (0.015, 0.045, 0.015),
    (-0.16771051558419411, -0.1983722658245161, 0.9656715938216944),
]
Create points, line and plane objects#
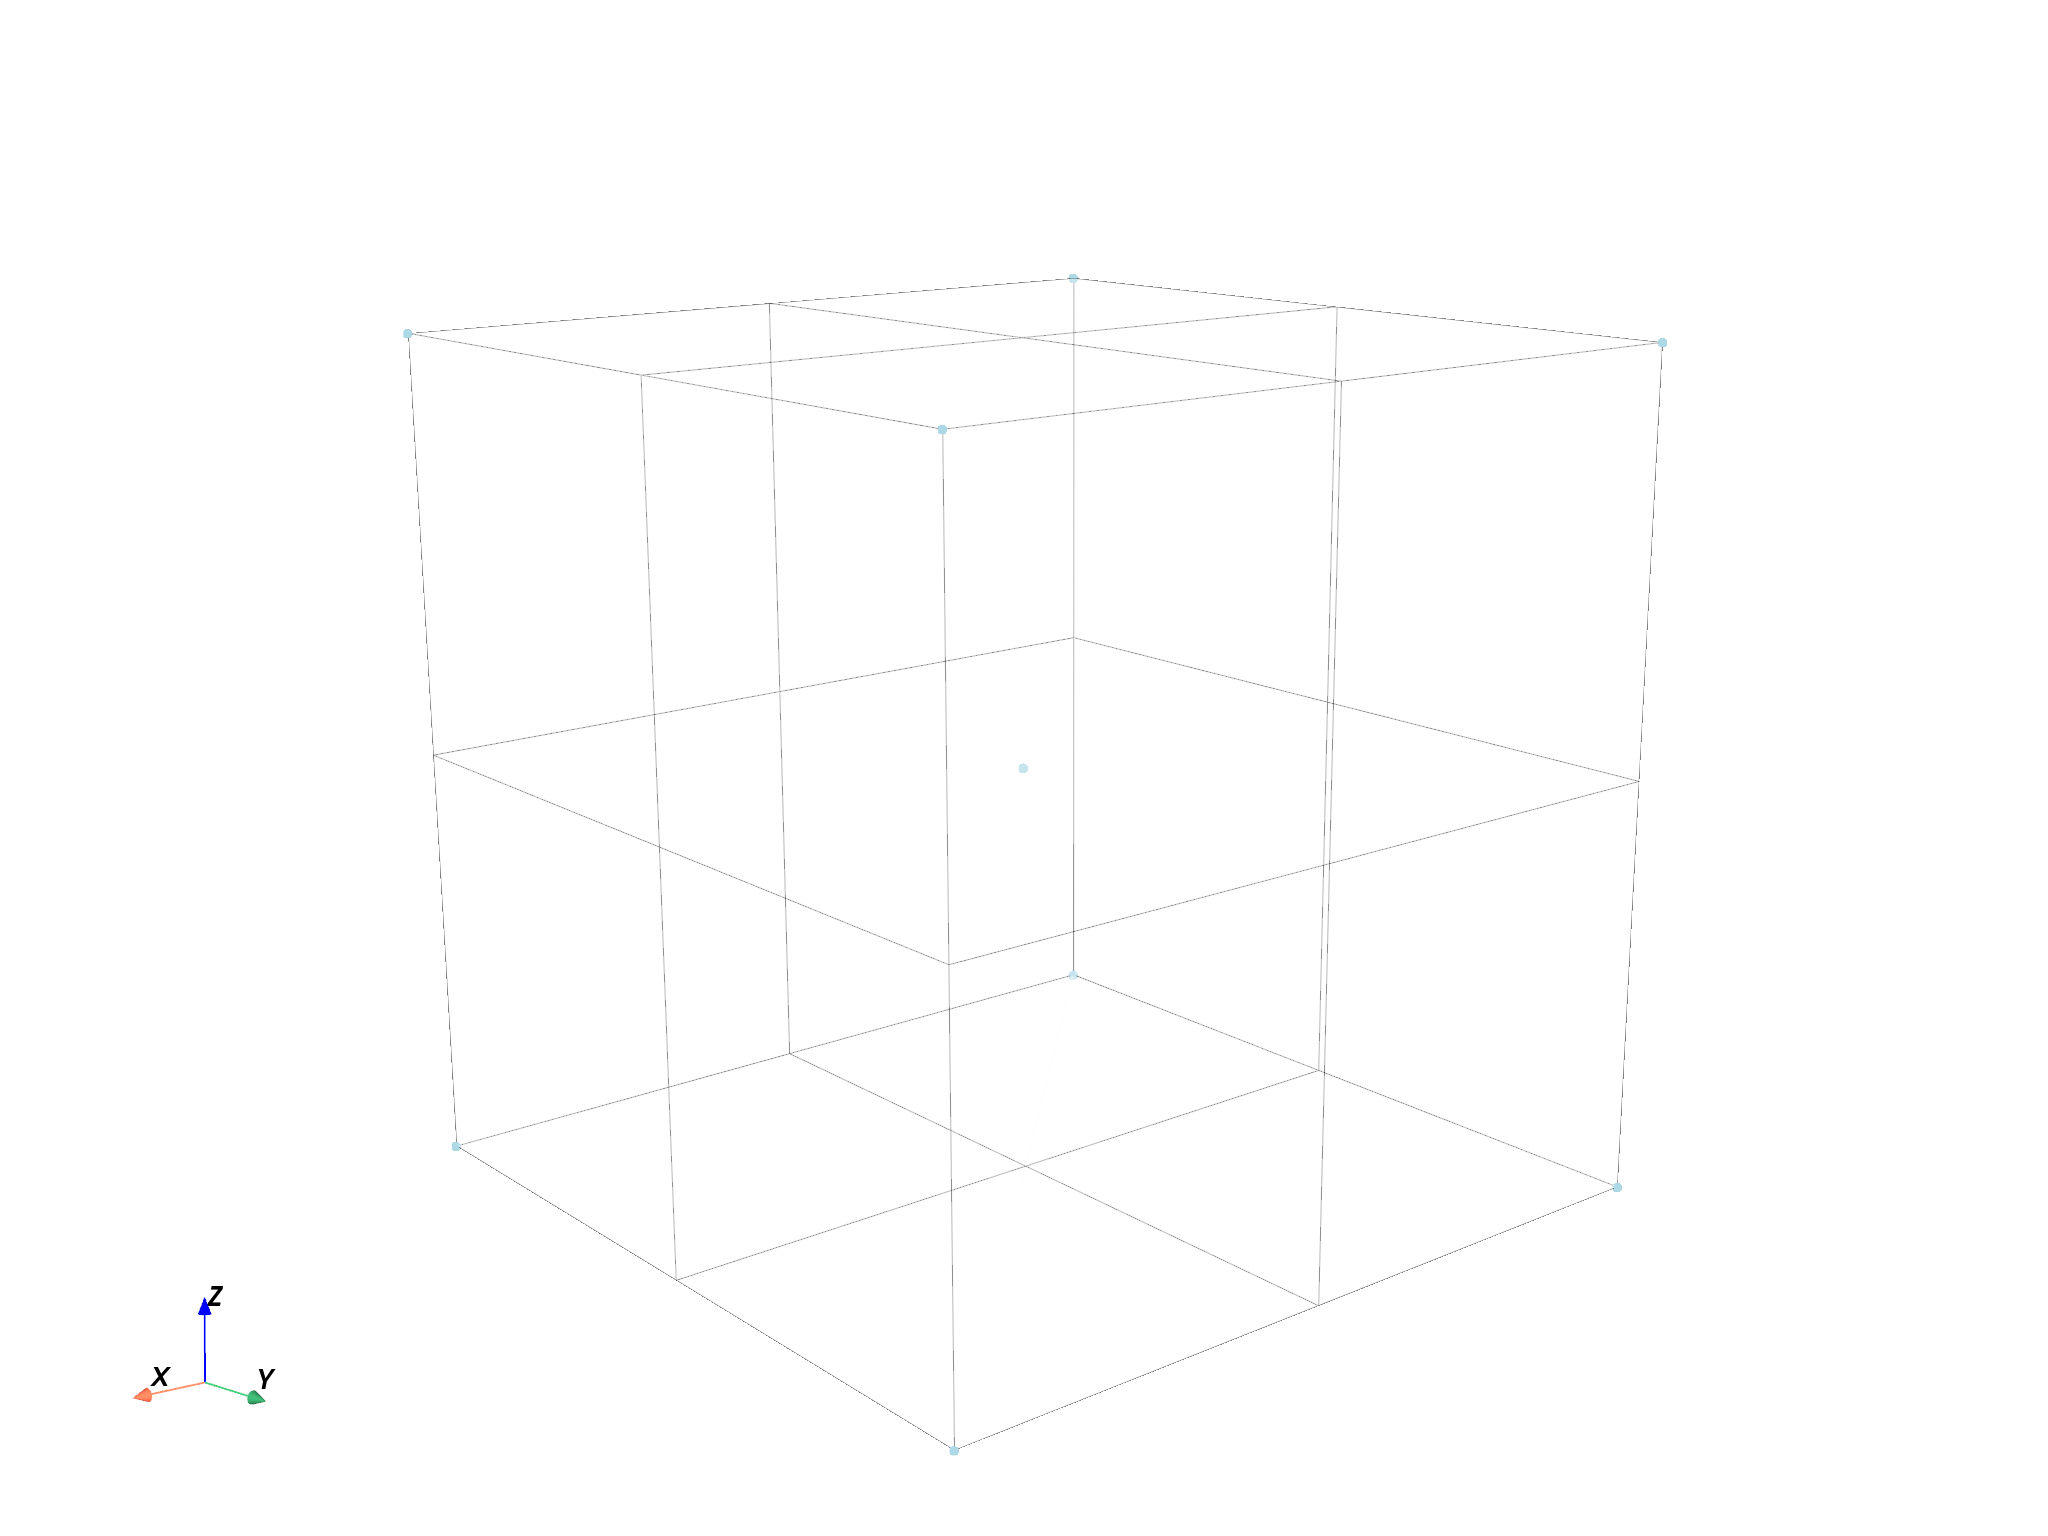
Create 8 points in the corners and one in the middle:
points = Points(
    [
        [0.0, 0.03, 0.0],
        [0.0, 0.03, 0.03],
        [0.0, 0.06, 0.00],
        [0.0, 0.06, 0.03],
        [0.03, 0.03, 0.0],
        [0.03, 0.03, 0.03],
        [0.03, 0.06, 0.00],
        [0.03, 0.06, 0.03],
        [0.015, 0.045, 0.015],
    ]
)
Show points together with the mesh
points.plot(mesh, cpos=cpos, point_size=25, color="blue")
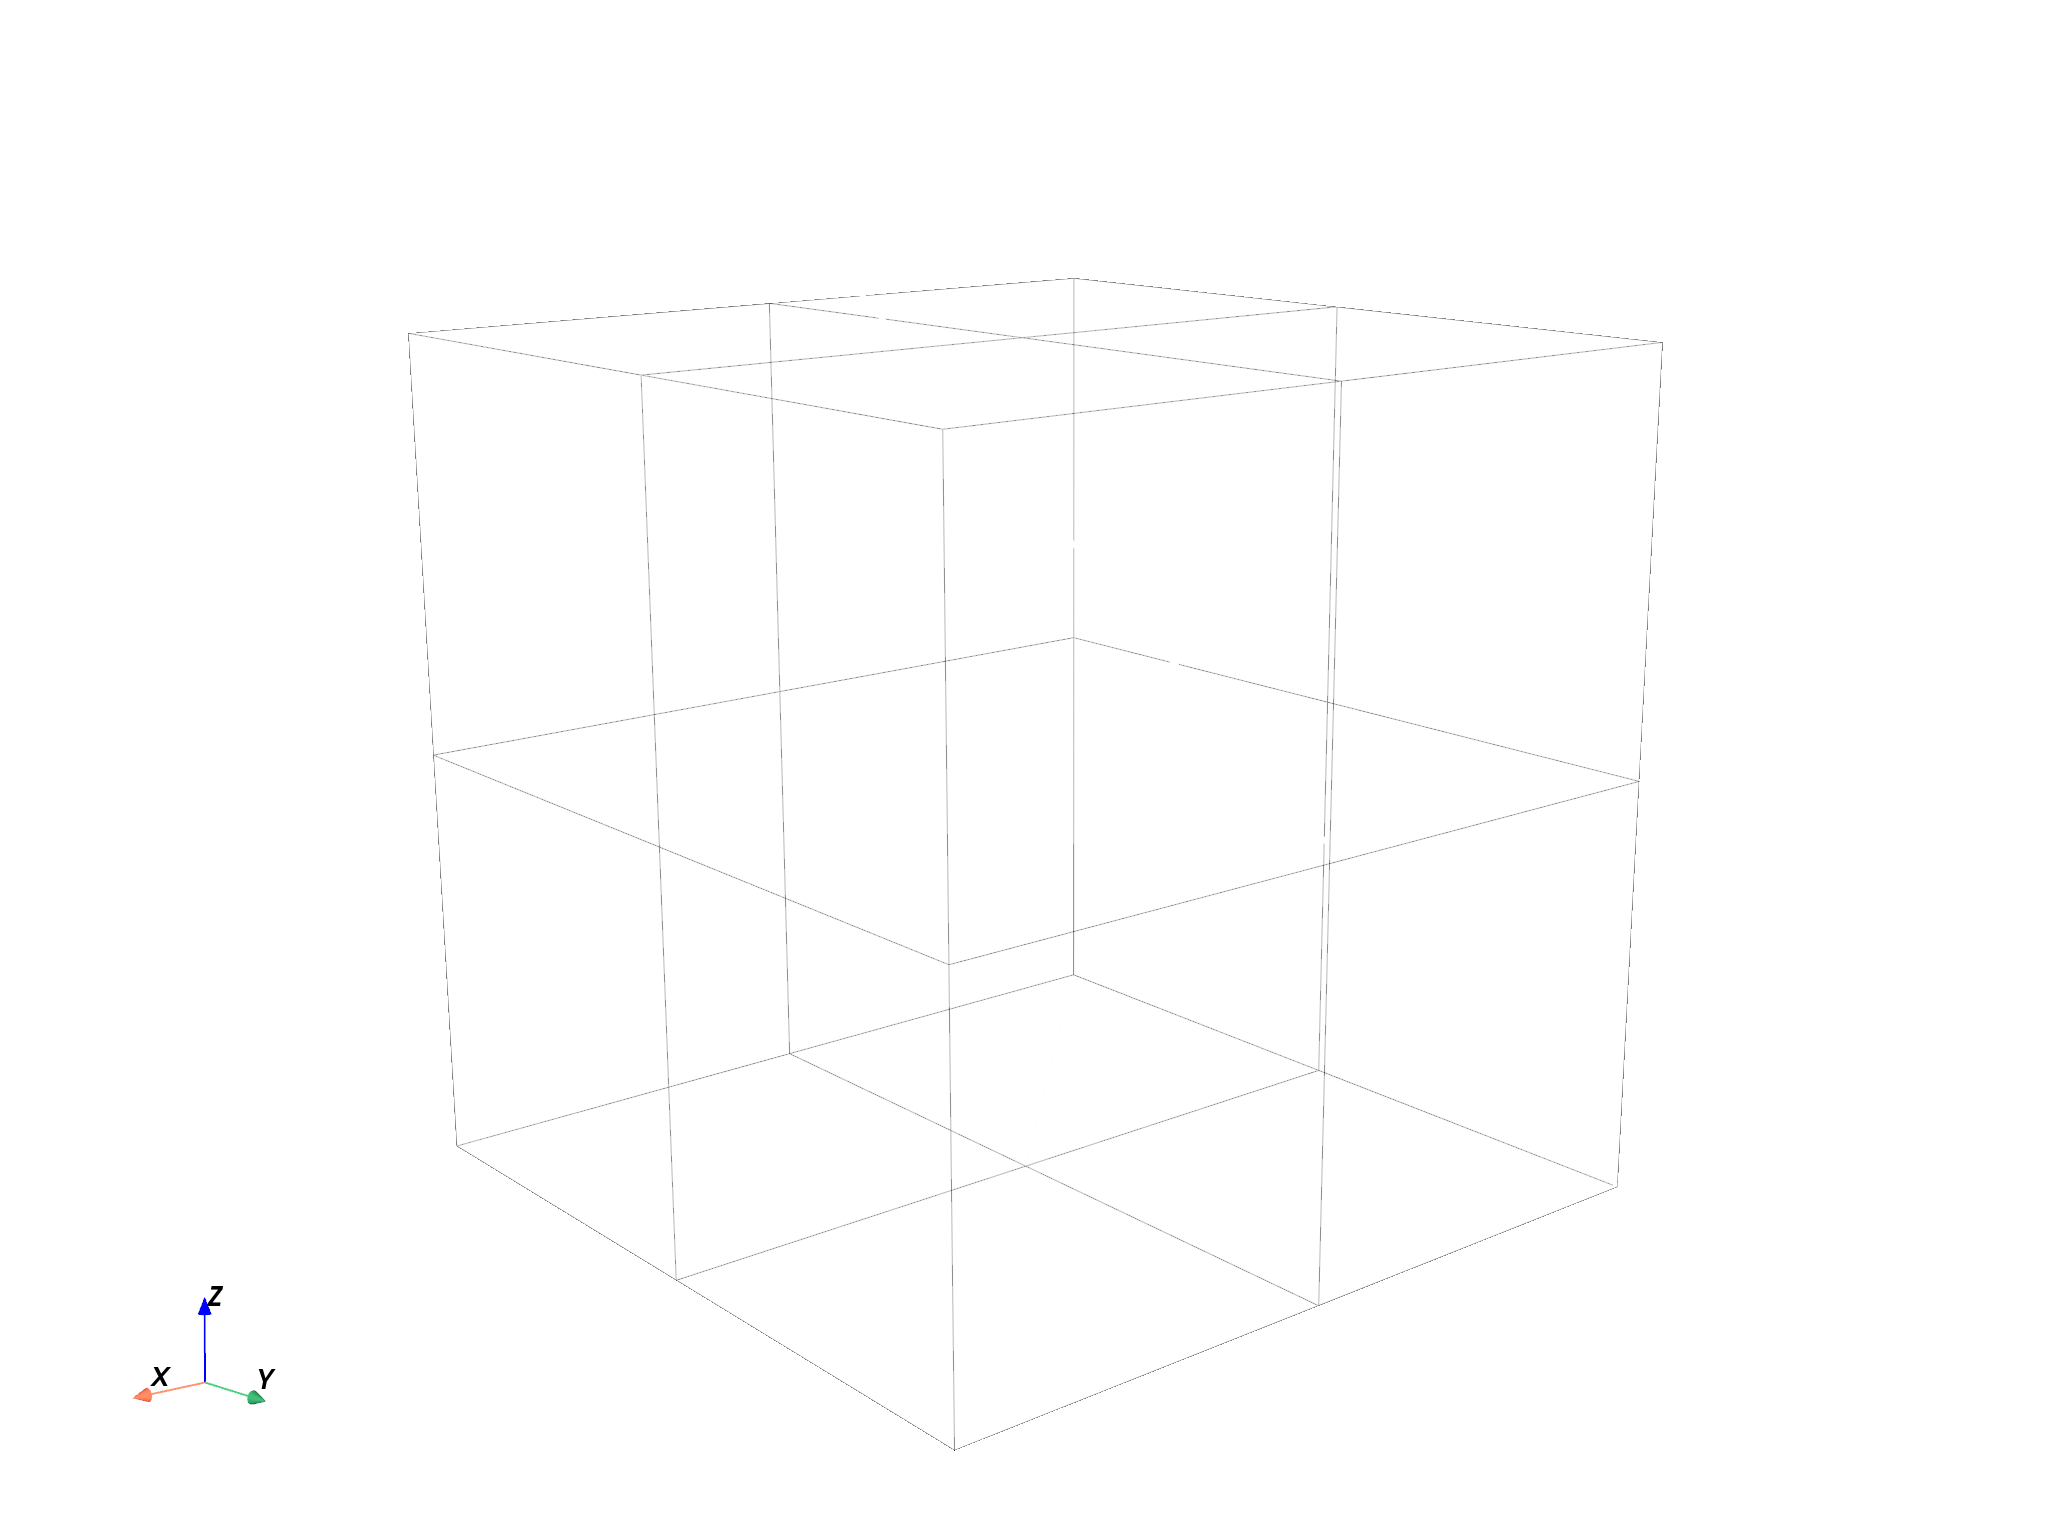
Create line passing through the geometry’s diagonal:
line = Line([[0.03, 0.03, 0.05], [0.0, 0.06, 0.0]], n_points=50)
Show line with the 3D mesh
line.plot(mesh, cpos=cpos, color="black", width=5.0)
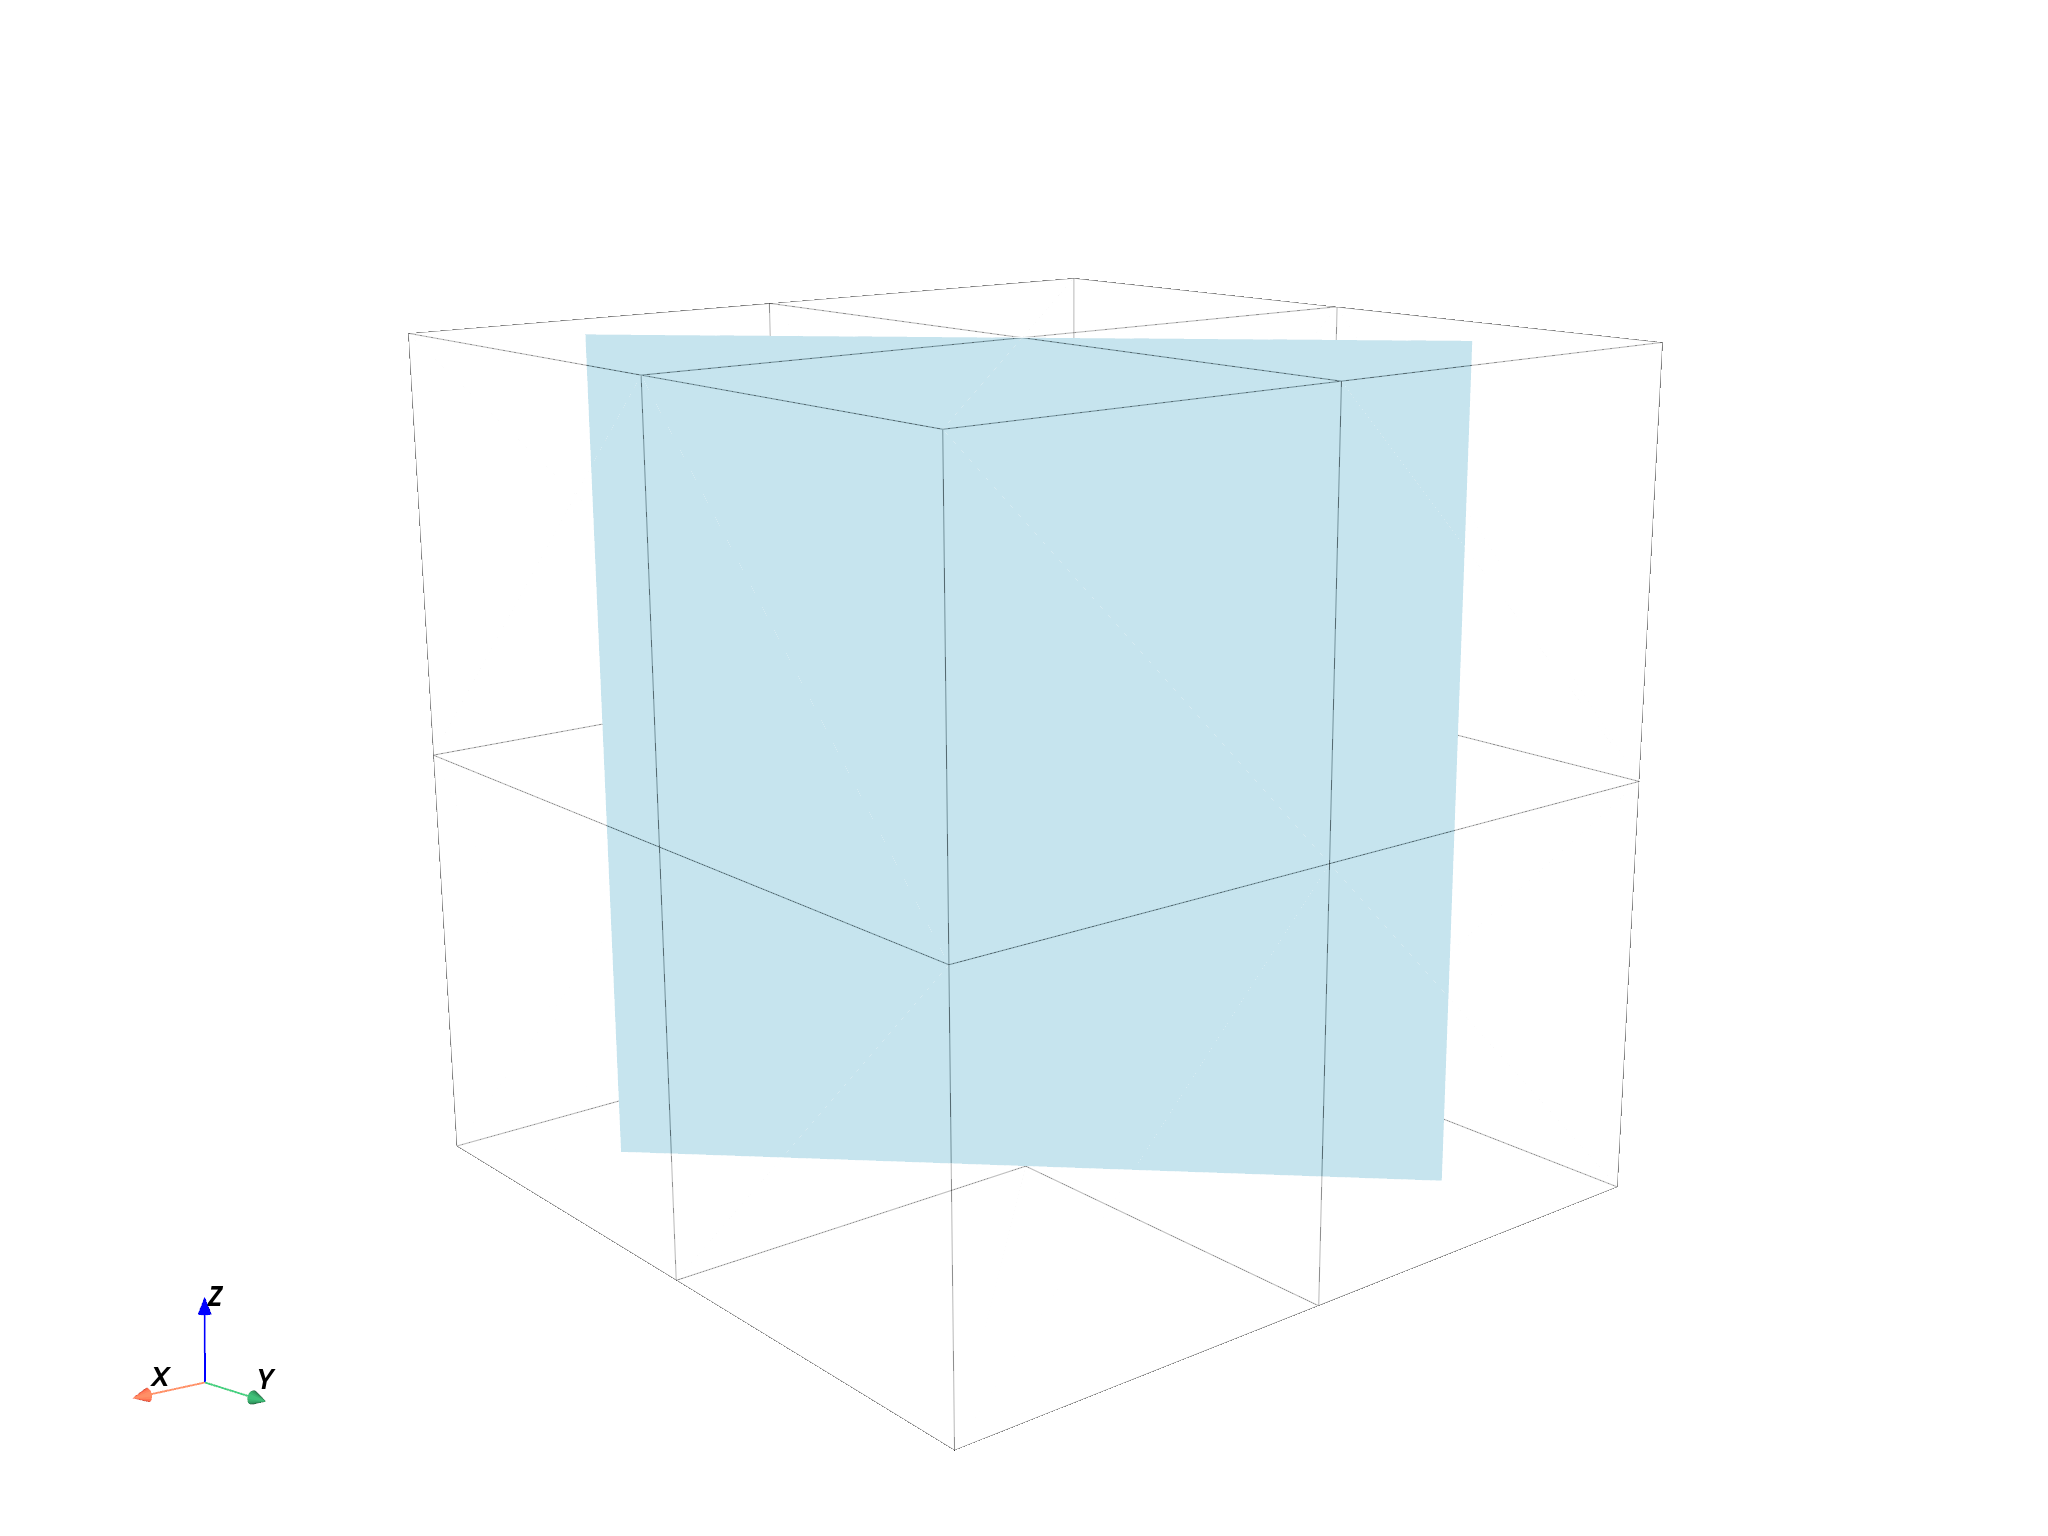
Create vertical plane passing through the mid point:
plane = Plane(
    [0.015, 0.045, 0.015],
    [1, 1, 0],
    width=0.03,
    height=0.03,
    n_cells_x=10,
    n_cells_y=10,
)
Show plane with the 3D mesh
plane.plot(mesh, cpos=cpos, color="red")
Map displacement field to geometry objects#
Get displacement field from model:
disp = model.results.displacement
Map displacement to points in Points object:
mapping_operator = ops.mapping.on_coordinates(
    fields_container=disp,
    coordinates=field_from_array(points.coordinates.data),
    create_support=True,
    mesh=mesh,
)
fields_mapped = mapping_operator.outputs.fields_container()
field_points = fields_mapped[0]
Map displacement to points in Line object:
mapping_operator = ops.mapping.on_coordinates(
    fields_container=disp,
    coordinates=line.mesh.nodes.coordinates_field,
    create_support=True,
    mesh=mesh,
)
fields_mapped = mapping_operator.outputs.fields_container()
field_line = fields_mapped[0]
Map displacement to points in Plane object:
mapping_operator = ops.mapping.on_coordinates(
    fields_container=disp,
    coordinates=plane.mesh.nodes.coordinates_field,
    create_support=True,
    mesh=mesh,
)
fields_mapped = mapping_operator.outputs.fields_container()
field_plane = fields_mapped[0]
Plotting displacement field on the geometry objects#
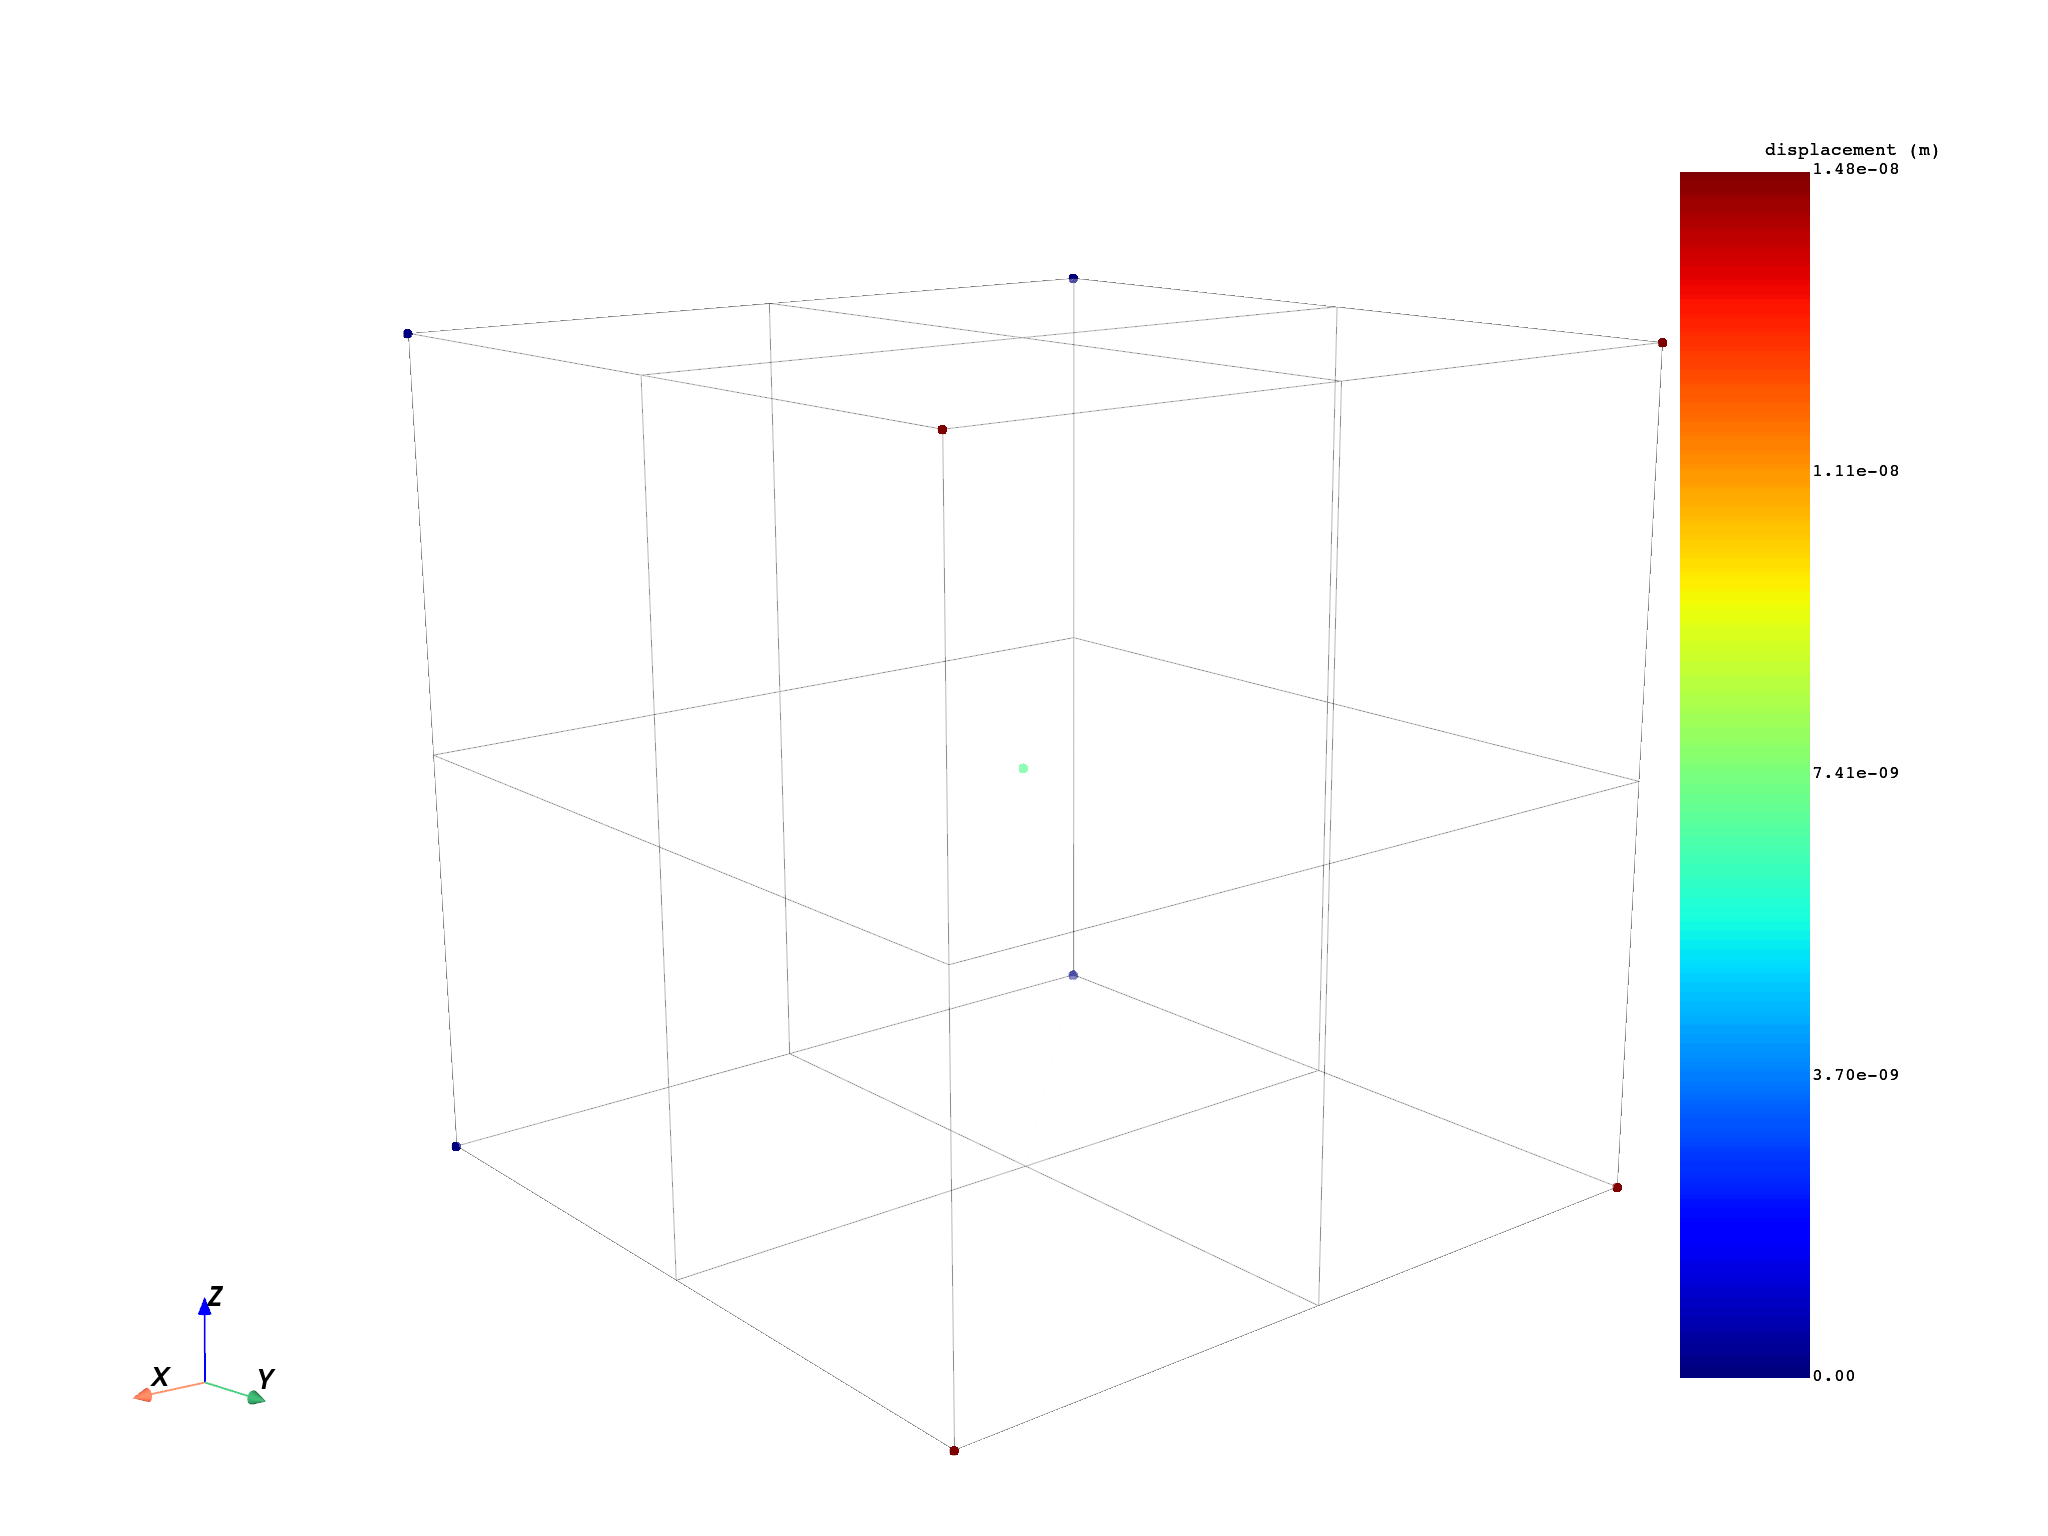
3D plot of Points and display mesh:
pl = DpfPlotter()
pl.add_field(field_points, render_points_as_spheres=True, point_size=25)
pl.add_mesh(mesh, style="surface", show_edges=True, color="w", opacity=0.3)
pl.show_figure(show_axes=True, cpos=cpos)
([], <pyvista.plotting.plotter.Plotter object at 0x000002408DF9CB90>)
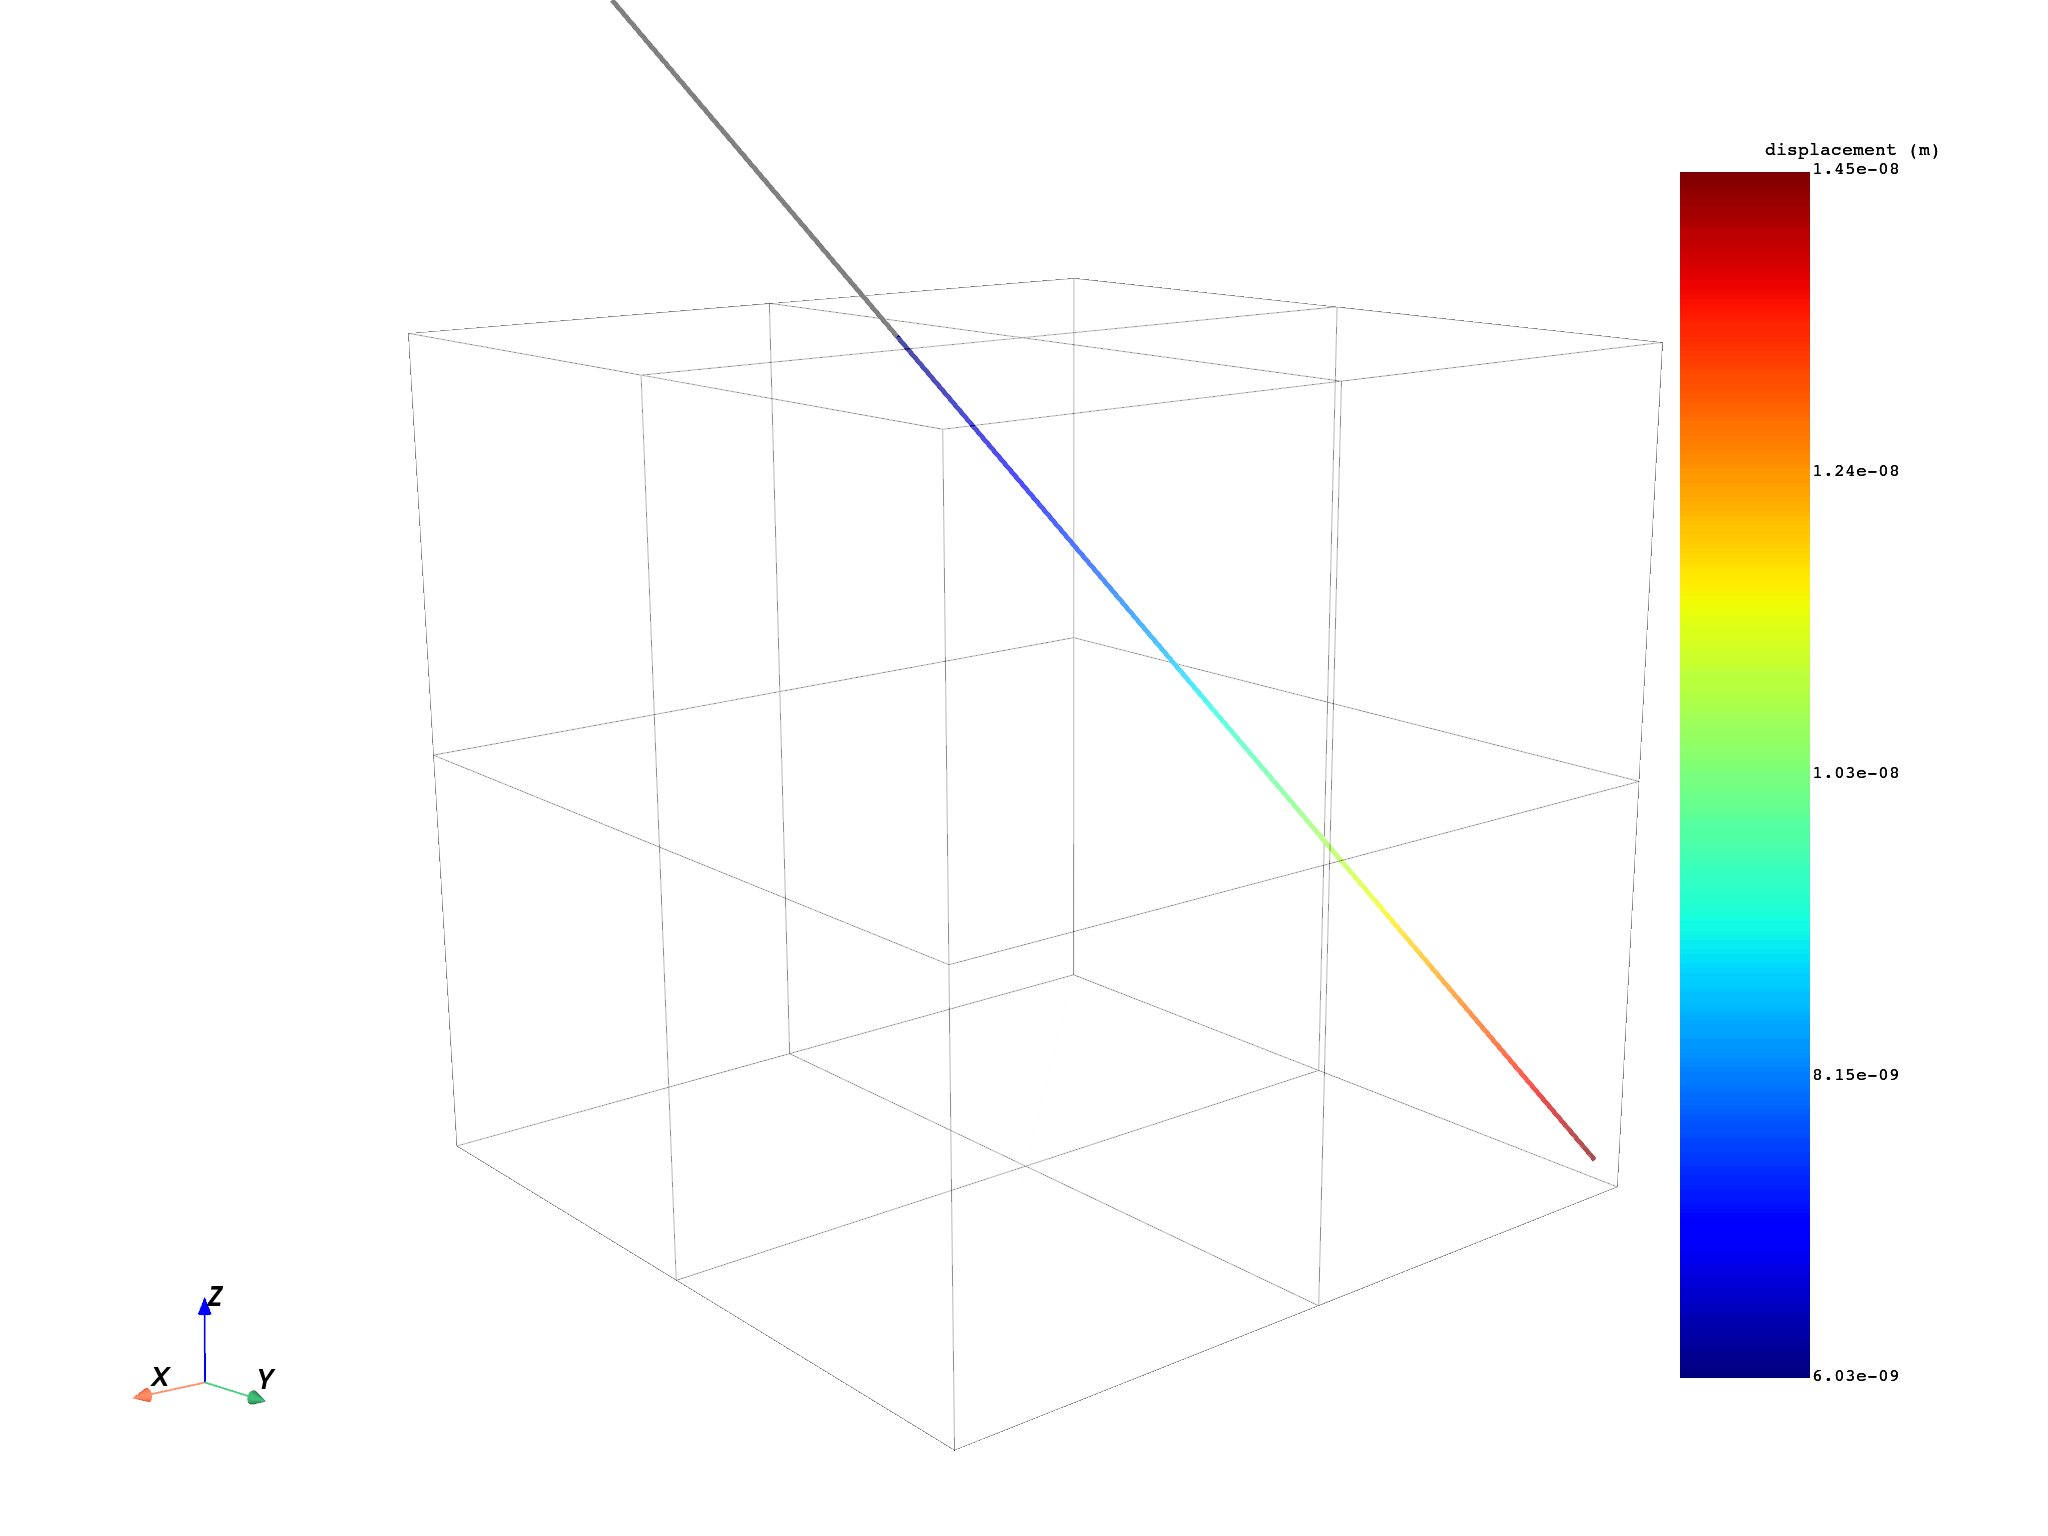
3D plot of Line and mesh. Note that the line is only displayed if some points are found inside the mesh:
pl = DpfPlotter()
if not len(field_line) == 0:
    pl.add_field(field_line, line.mesh, line_width=10)
pl.add_mesh(mesh, style="surface", show_edges=True, color="w", opacity=0.3)
pl.show_figure(show_axes=True, cpos=cpos)
([], <pyvista.plotting.plotter.Plotter object at 0x000002408C44C0D0>)
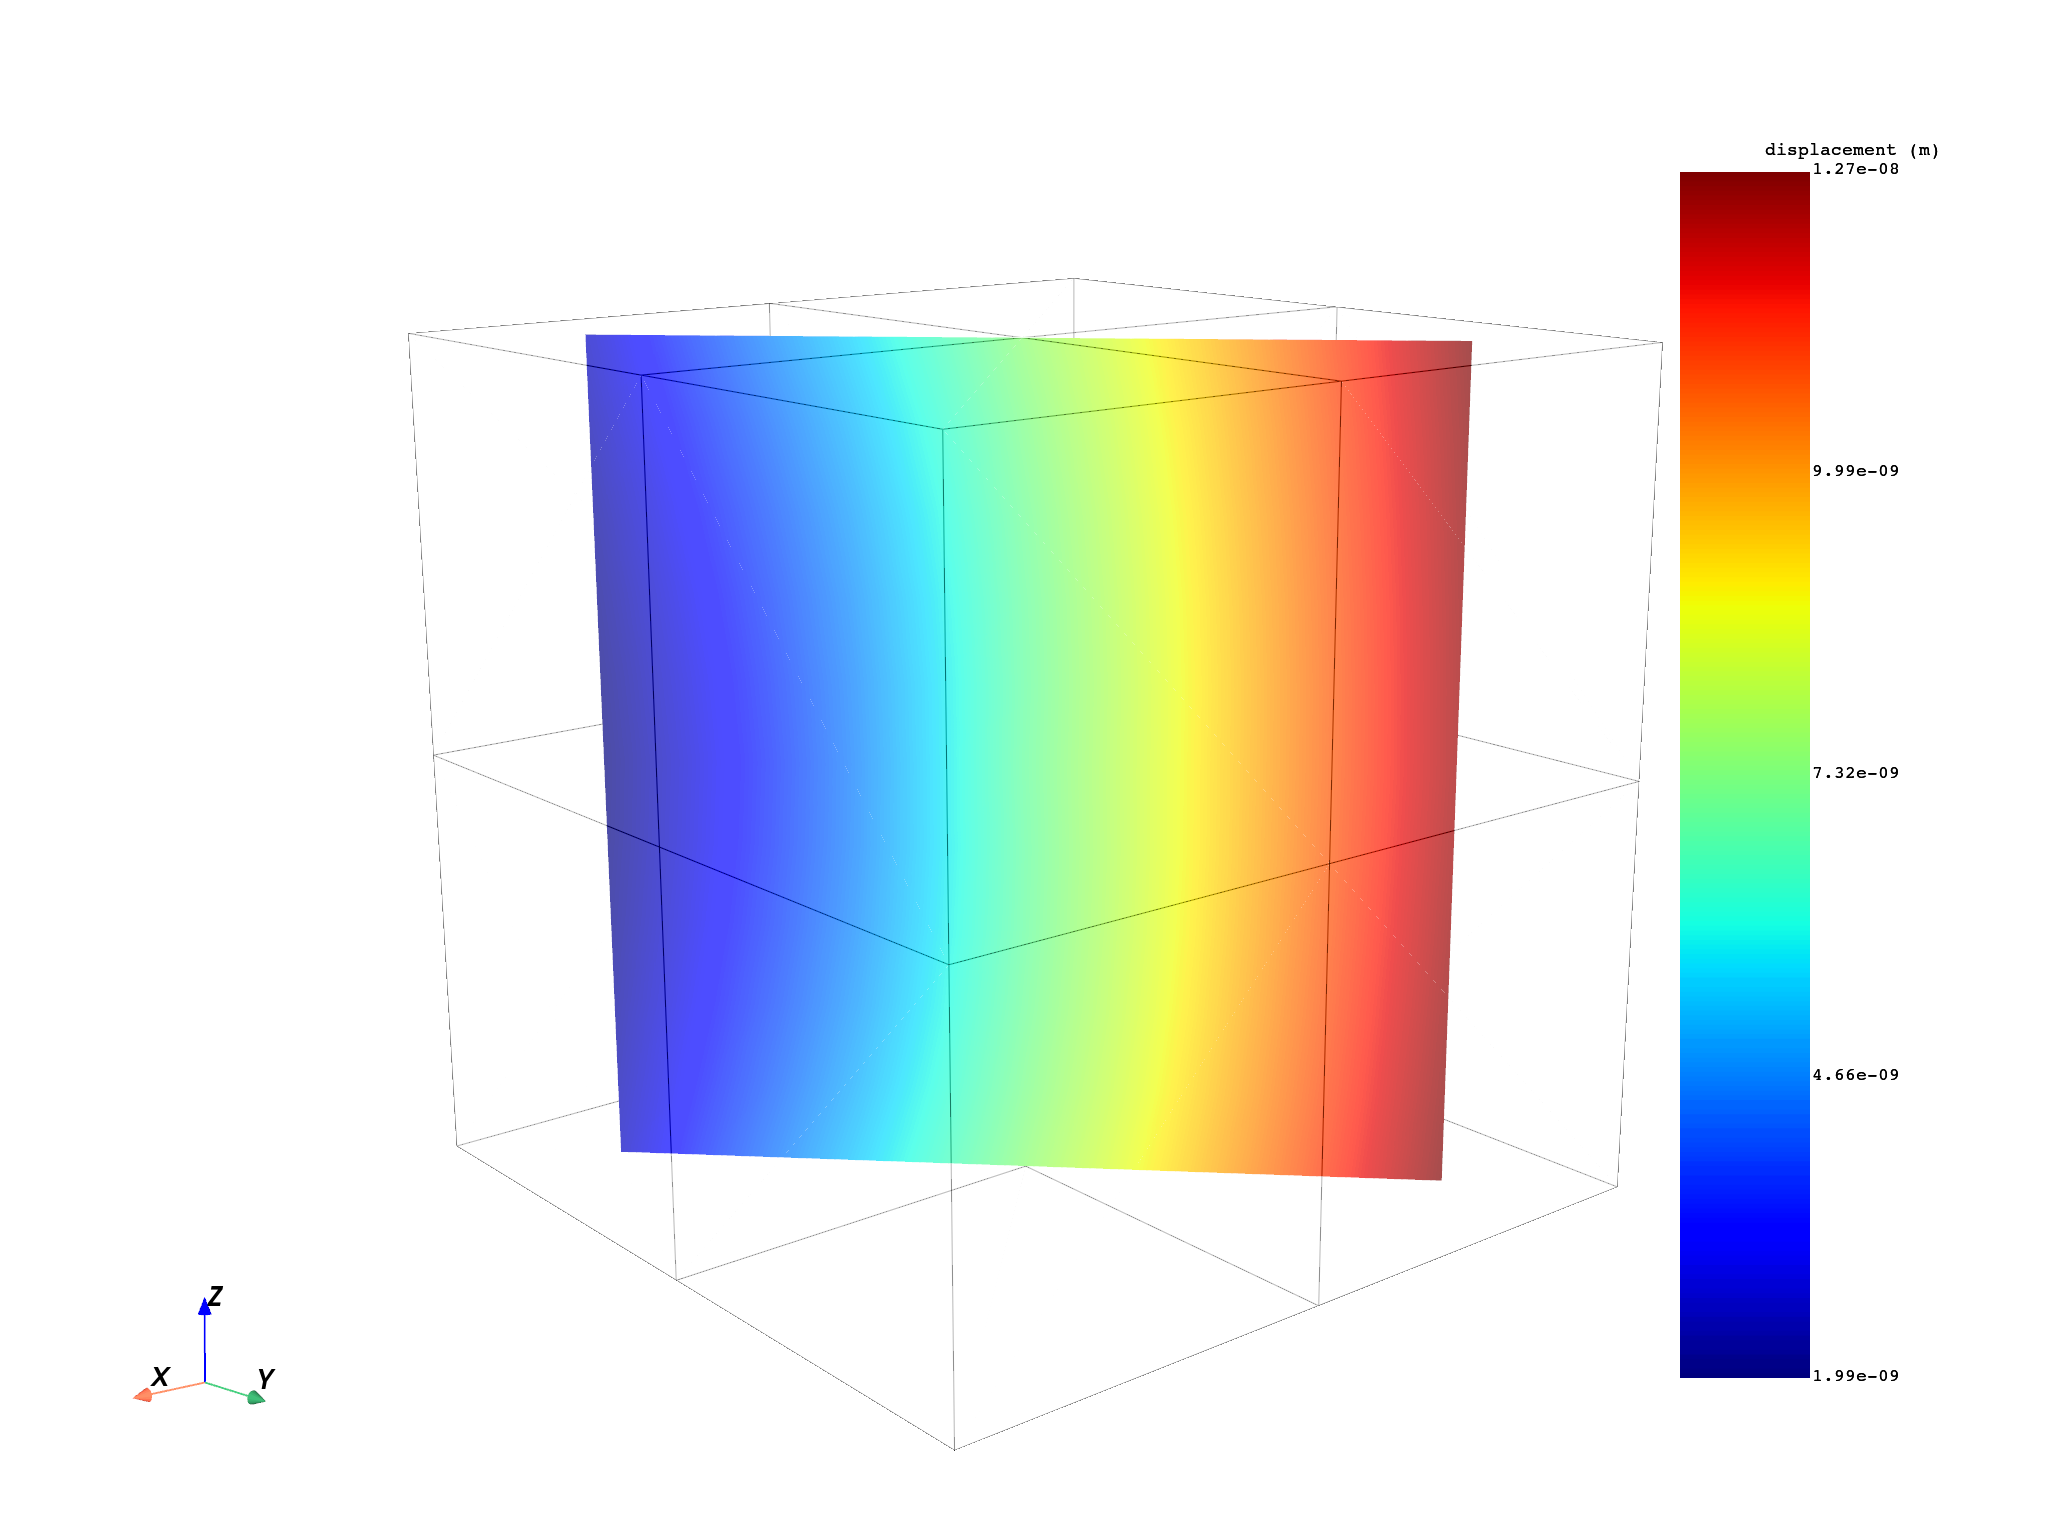
Plot Plane and display mesh in background. Note that the plane is only displayed if some points are found inside the mesh:
pl = DpfPlotter()
if not len(field_plane) == 0:
    pl.add_field(field_plane, plane.mesh, show_edges=False)
pl.add_mesh(mesh, style="surface", show_edges=True, color="w", opacity=0.3)
pl.show_figure(show_axes=True, cpos=cpos)
([], <pyvista.plotting.plotter.Plotter object at 0x0000024080550B90>)
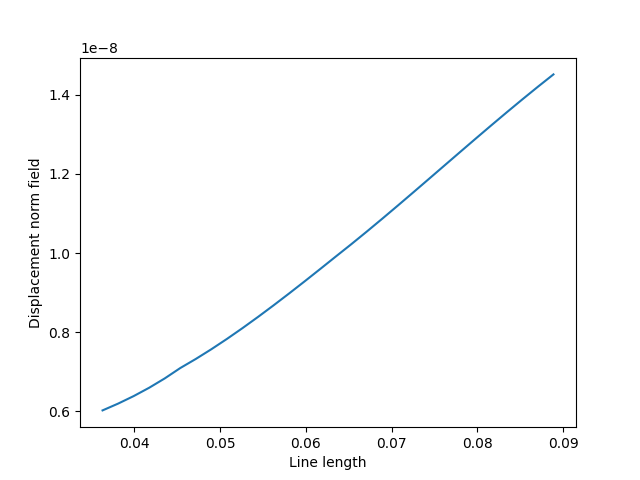
2D plot (graph) of Line (line length vs displacement field):
norm_disp = [np.linalg.norm(field_line.data[i]) for i in range(len(field_line.data))]
path = line.path[field_line.scoping.ids - 1]
plt.plot(path, norm_disp)
plt.xlabel("Line length")
plt.ylabel("Displacement norm field")
plt.show()
Total running time of the script: (0 minutes 7.330 seconds)