Create a mesh from scratch#
This tutorial demonstrates how to build a MeshedRegion from scratch.
The mesh object in DPF is a MeshedRegion. You can create your own MeshedRegion object and use it
with DPF operators. The ability to use scripting to create any DPF entity means
that you are not dependent on result files and can connect the DPF environment
with any Python tool.
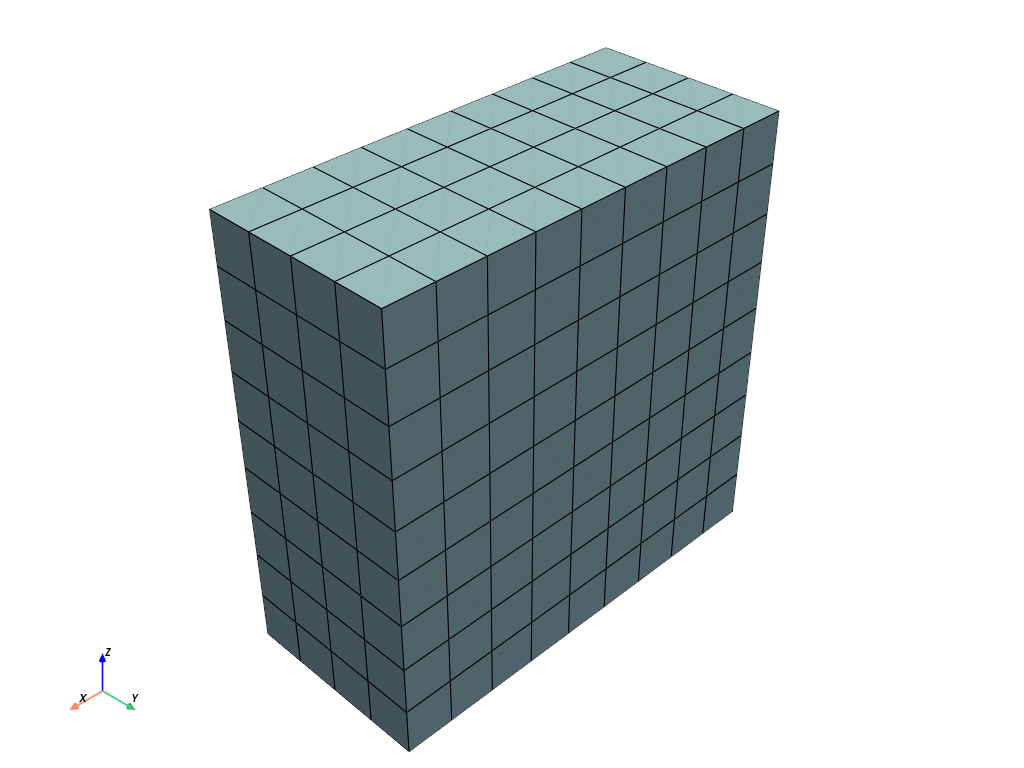
In this tutorial, we create a parallel piped mesh made of linear hexa elements.
Download tutorial as Python script
Download tutorial as Jupyter notebook
Import the necessary modules#
Import the ansys.dpf.core module, including the operators module and the numpy library.
# Import the numpy library
import numpy as np
# Import the ``ansys.dpf.core`` module
from ansys.dpf import core as dpf
# Import the operators module
from ansys.dpf.core import operators as ops
Define the mesh dimensions#
# Define the mesh dimensions
length = 0.1
width = 0.05
depth = 0.1
num_nodes_in_length = 10
num_nodes_in_width = 5
num_nodes_in_depth = 10
# Create a MeshedRegion object
my_meshed_region = dpf.MeshedRegion()
Define the connectivity function#
To create a mesh you must define the nodes connectivity. This means to define the nodes ids connected to each element.
Here, we create a function that will find this connectivity.
def search_sequence_numpy(arr, node):
    """Find the node location in an array of nodes and return its index."""
    indexes = np.isclose(arr, node)
    match = np.all(indexes, axis=1).nonzero()
    return int(match[0][0])
Add nodes#
Add Nodes to the MeshedRegion object.
node_id = 1
for i, x in enumerate(
    [float(i) * length / float(num_nodes_in_length) for i in range(0, num_nodes_in_length)]
):
    for j, y in enumerate(
        [float(i) * width / float(num_nodes_in_width) for i in range(0, num_nodes_in_width)]
    ):
        for k, z in enumerate(
            [float(i) * depth / float(num_nodes_in_depth) for i in range(0, num_nodes_in_depth)]
        ):
            my_meshed_region.nodes.add_node(node_id, [x, y, z])
            node_id += 1
Get the nodes coordinates field.
my_nodes_coordinates = my_meshed_region.nodes.coordinates_field
Set the mesh properties#
Set the mesh unit.
my_meshed_region.unit = "mm"
Set the nodes coordinates.
# Get the nodes coordinates data
my_nodes_coordinates_data = my_nodes_coordinates.data
# As we use the connectivity function we need to get the data as a list
my_nodes_coordinates_data_list = my_nodes_coordinates.data_as_list
# Set the nodes scoping
my_coordinates_scoping = my_nodes_coordinates.scoping
Add elements#
Add Elements to the MeshedRegion object.
# Add solid elements (linear hexa with eight nodes):
element_id = 1
# Precompute node spacings
dx = length / float(num_nodes_in_length)
dy = width / float(num_nodes_in_width)
dz = depth / float(num_nodes_in_depth)
# Generate node coordinates
x_coords = [i * dx for i in range(num_nodes_in_length - 1)]
y_coords = [j * dy for j in range(num_nodes_in_width - 1)]
z_coords = [k * dz for k in range(num_nodes_in_depth - 1)]
# Iterate through the grid
for x in x_coords:
    for y in y_coords:
        for z in z_coords:
            coord1 = np.array([x, y, z])
            connectivity = []
            # Generate connectivity for the current element
            for xx in [x, x + dx]:
                for yy in [y, y + dy]:
                    for zz in [z, z + dz]:
                        scoping_index = search_sequence_numpy(my_nodes_coordinates_data,
                                                           [xx, yy, zz])
                        connectivity.append(scoping_index)
            # Rearrange connectivity to maintain element orientation
            connectivity[2], connectivity[3] = connectivity[3], connectivity[2]
            connectivity[6], connectivity[7] = connectivity[7], connectivity[6]
            # Add the solid element
            my_meshed_region.elements.add_solid_element(element_id, connectivity)
            element_id += 1
Plot the mesh#
You can check the mesh we just created with a plot. For more information on how to plot a mesh see the ref_tutorials_plotting_meshes tutorial.
# Plot the mesh
my_meshed_region.plot()
(None, <pyvista.plotting.plotter.Plotter at 0x19327c45c90>)