Plotting#
DPF-Core has a variety of plotting methods for generating 3D plots of Ansys models directly from Python. These methods use VTK and leverage the PyVista library to simplify plotting. For more information, see the PyVista Documentation.
Plot the mesh from the Model object#
The Model.plot() method
plots the mesh of the model immediately after loading it.
This example downloads a simple pontoon mesh from the internet and uses the
ansys.dpf.core.model class to load it:
import ansys.dpf.core as dpf
from ansys.dpf.core import examples
filename = examples.download_pontoon()
model = dpf.Model(filename)
model.plot()
The default plotter settings display the mesh with edges shown and lighting enabled. For a list of all keyword arguments, see plot.
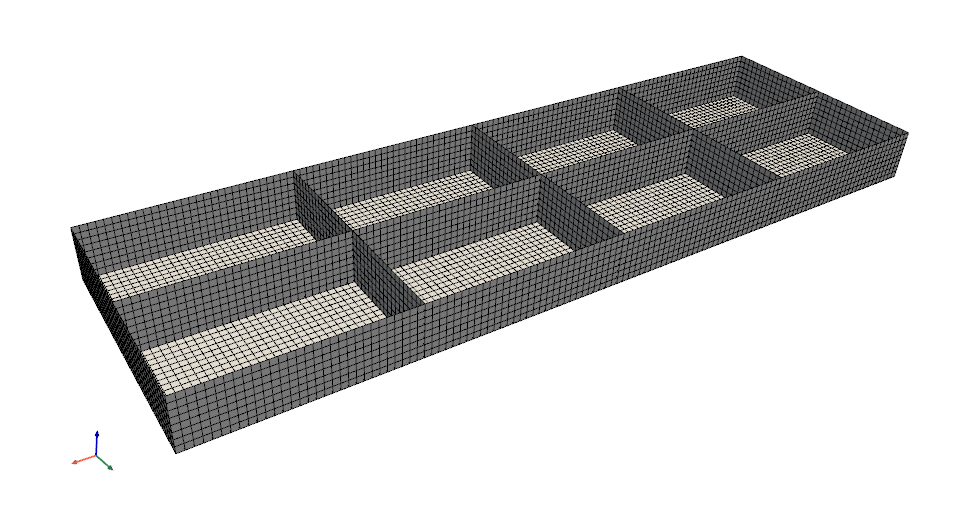
Plot the meshed region#
The MeshedRegion.plot()
method plots the meshed region. If the meshed region is generated from the model’s
metadata, the plot generated is identical to the plot generated by the
Model.plot() method.
Plot the meshed region
mesh = model.metadata.meshed_region
mesh.plot()
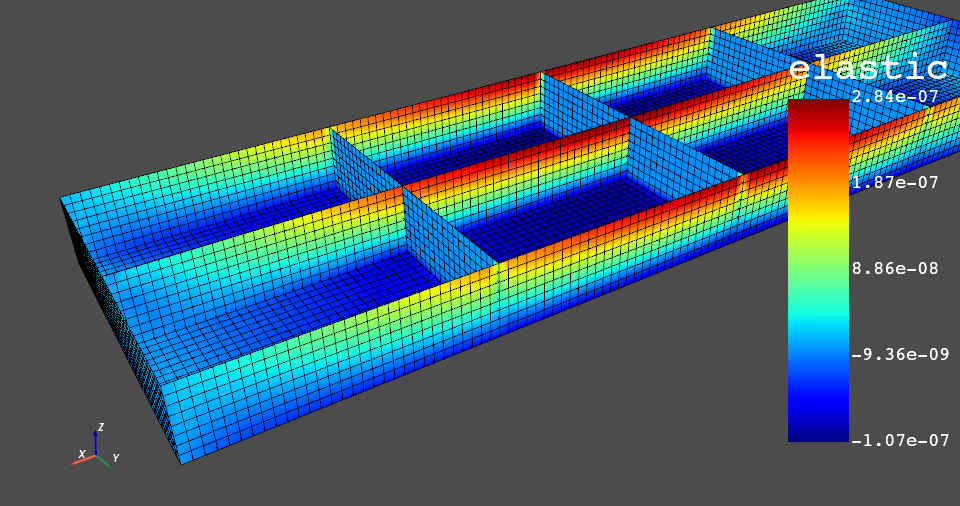
When a field is provided as the first argument, the mesh is plotted using these values.
This example extracts the nodal strain in the X direction:
First, extract the X component strain
strain = model.results.elastic_strain()
fields = strain.outputs.fields_container()
field = fields.select_component(0)[0]
print(field)
DPF elastic_strain_1.s0 Field
  Location: ElementalNodal
  Unit:
  8640 entities
  Data:1 components and 69120 elementary data
This ElementalNodal strain must be converted to a nodal strain for it to be plotted.
nodal_field = field.to_nodal()
mesh.plot(nodal_field)
Note
Only fields with Nodal and Elemental locations are
supported. Use the to_nodal
operator to convert to the Nodal location or the
ansys.dpf.core.operators.averaging.nodal_to_elemental
class to convert to the Elemental location.